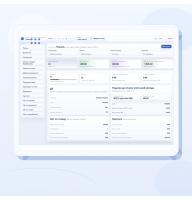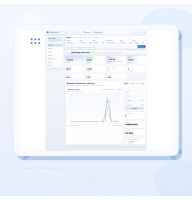



Most owners can control a company with 8–12 key metrics when those measures cover results, cash, customers and fulfilment. The purpose is not to describe everything that happened. It is to identify a deviation quickly, show its scale and point to the process where the cause can be investigated.
Revenue alone is not a control system. It can rise while margin falls, overdue receivables grow and slow-moving inventory accumulates. The measures must therefore form one connected picture: what the company earned, whether the money arrived, which sales created the result and whether the operation fulfilled its promises.
What makes a KPI different from an ordinary report number
A metric describes a fact: 320 orders, UAH 1.2 million of revenue or 18 average days in stock. A KPI is connected to a goal, an acceptable deviation and a person responsible for the response. “At least 95% of orders dispatched on time” allows management to recognise a problem and identify who must investigate it.
A useful indicator answers four questions:
- Which management decision depends on this number?
- Which source transactions produce it?
- Is it compared with a plan, a prior period or an operating standard?
- Who responds, and by when?
If a number is interesting but triggers neither an investigation nor an action, it can remain in a detailed analysis report. It does not belong on the owner’s main view.
Four layers of business control
| Layer | What it reveals | Example measures |
|---|---|---|
| Financial result | Whether activity creates an economic return | Revenue, gross margin, contribution margin and operating profit |
| Cash and obligations | Whether upcoming commitments can be paid | Cash balance, cash forecast, overdue receivables and payables |
| Sales and customers | Whether the flow of future revenue is healthy | New enquiries, conversion, average order value, repeat sales and sales-cycle length |
| Operational fulfilment | Whether the company can deliver what it promised without avoidable loss | On-time orders, order cycle, shortages, returns and production load |
The layers cannot substitute for one another. Financial results are lagging indicators: the problem has already occurred. Sales and operational measures provide earlier signals, but without the financial layer their economic impact remains unclear.
A practical minimum set for an owner
The exact selection depends on the business model. The following set is a sensible starting point for a trading, manufacturing or service company.
| Measure | What it helps reveal | Review frequency |
|---|---|---|
| Revenue and plan attainment | Change in sales volume | Weekly, with a monthly close |
| Contribution margin | What remains after direct variable costs | Weekly or monthly |
| Operating profit | Whether fixed costs have been covered | Monthly |
| Cash balance and forecast | Risk of a cash shortfall | Daily or weekly |
| Overdue receivables | Sales that have not yet become cash | Weekly |
| Sales conversion | Where available demand is being lost | Weekly |
| Orders delivered on time and in full | Fulfilment reliability | Daily, summarised weekly |
| Inventory and days in stock | Shortages and cash frozen in stock | Weekly or monthly |
| Returns and complaints | Quality loss and repeated work | Weekly |
Every measure does not need equal visual weight. The main view can show the current value, comparison and status. A drill-down should reveal the cause by business unit, salesperson, customer, product, order or source transaction.
Formulas that need precise definitions
Plan attainment, % = Actual / Plan × 100%.
Contribution margin = Revenue − direct variable costs.
Conversion = Successful deals / qualified enquiries × 100%.
On-time and in-full rate = Orders completed on time and in full / all completed orders × 100%.
Inventory days = Average inventory / cost of sales for the period × days in the period.
The boundaries must be defined before a formula is adopted. Conversion from every incoming message, from qualified leads or from issued proposals produces three different measures. Changing the denominator without recording the change creates a false trend.
Worked example: why one metric is not enough
Consider a hypothetical month in a trading and manufacturing company. Planned revenue is UAH 1,200,000 and actual revenue is UAH 1,080,000, giving 90% attainment. At first glance, the variance looks manageable and might be explained by a few orders moving into the next month.
The connected set reveals more:
- planned contribution margin was UAH 300,000; actual contribution was UAH 216,000;
- overdue receivables increased from 9% to 17% of the balance;
- only 82% of orders were delivered on time and in full against a 95% target;
- inventory value grew by 14% even though sales declined.
The conclusion changes. This is not merely a sales-volume problem. The company sold a less profitable mix, collected cash more slowly, fulfilled orders less reliably and accumulated stock at the same time. Management should trace the result from margin segments to overdue orders, shortage causes and the purchases that increased inventory.
Select KPIs for the current business stage
The set should change when the company’s main constraint changes.
- At launch, monitor the cash runway, qualified enquiries, conversion, average order value and contribution.
- During sales growth, add order cycle, on-time fulfilment, team capacity, shortages and returns.
- With a broad range, add margin by segment, inventory days, ABC/XYZ analysis and slow-moving stock.
- When customers receive credit, strengthen receivables, credit-limit and cash-forecast controls.
- In manufacturing, monitor output, material consumption, defects, work in progress and actual-cost variance.
Choose an indicator from the management question, not because it is easy to calculate. If missed deadlines are the primary problem, another revenue chart cannot replace control of the order queue and delay reasons.
Plan, actual and response boundaries
A value without a comparison provides little control. Give each KPI an appropriate base:
- a plan where the company is managing towards a specific objective;
- a comparable prior period to identify direction;
- the same period last year where seasonality matters;
- an operating standard for time, quality and service;
- a forecast for cash, capacity and future sales.
Use a warning zone as well as a critical limit. If the fulfilment target is 95%, 92–95% might require attention and below 92% might require immediate intervention. Boundaries should reflect economics and process capability, not convenient round numbers.
How often each measure should be reviewed
Frequency depends on how quickly the result can still be influenced. Cash balances and overdue orders may require daily attention. A contribution result for a closed month does not need to refresh every ten minutes.
A practical rhythm is:
- Daily: cash, critical delays, orders due for dispatch and shortages.
- Weekly: sales, pipeline, fulfilment, purchasing and receivables.
- Monthly: profit, margin by segment, fixed costs, inventory days and plan versus actual.
- Quarterly: whether the KPI set and its target boundaries are still relevant.
Frequent refreshes do not repair poor source data. Every number needs a defined recognition event: order creation, dispatch, payment or period close.
Common management-dashboard errors
- Too many measures. Critical deviations disappear among dozens of charts.
- Activity replaces outcome. Call volume rises while conversion and contribution fall.
- Cash is confused with profit. Collection of an old debt is treated as profit generated today.
- An average hides segments. One strong group makes the company-wide margin look acceptable.
- No one owns the response. Everyone sees the red indicator, but no one must investigate it.
- The formula changes silently. Historical periods cease to be comparable.
- The result cannot be traced to transactions. The team debates the number instead of removing the cause.
Implementation without an overloaded dashboard
- List five decisions the owner makes regularly.
- For each decision, choose one outcome measure and one early indicator.
- Define the formula, source, period and update event.
- Verify the calculation manually against several source transactions.
- Set the plan, warning boundary and critical boundary.
- Assign responsibility for investigation, not merely data entry.
- Allow a total deviation to be opened into its segments and documents.
- After one month, remove measures that led to no decision.
Connecting control in Business Reactor
A management measure becomes more reliable when it is calculated from the same orders, payments, stock movements and production operations used by the team. The owner sees the total and can trace a deviation to a product, customer, order or fulfilment stage.
In Business Reactor, the set of measures and their calculation rules are defined around the company’s actual model. The objective is to connect the financial result to sales and operations rather than maintain a separate spreadsheet governed by different rules.
Conclusion
Key business metrics for owners are not a universal collection of attractive numbers. A working set covers profit, cash, future sales and the ability to fulfil obligations. Every indicator has a formula, comparison base, response boundary and accountable owner.
The next step is a plan-versus-actual process in which every material variance leads to a specific cause and action. View the related Business Reactor solution.