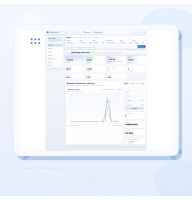


Plan versus actual analysis compares an expected result with the outcome and then breaks a material variance into its causes. A working report must answer not only “how far did we miss the plan?” but also “which product, customer, price, cost or process failure created the difference?”
A formal plan–actual–percentage table records the result but does not support management. To turn comparison into a decision, the data must be comparable, the effects of volume, price and cost must be separated, and every corrective action needs an owner and review date.
What should be compared
Plan versus actual is not limited to revenue. A company can achieve its sales target and miss its profit target because the product mix changed or discounts, costs and channel commission increased.
| Control area | What to compare | Question answered |
|---|---|---|
| Sales | Units, revenue, price, average order value and conversion | Whether demand and sales-team output were sufficient |
| Margin | Gross and contribution results by segment | Which sales genuinely contributed towards costs |
| Cash | Receipts, payments, balance and overdue amounts | Whether the economic result became cash flow |
| Inventory | Stock, shortages, purchasing and inventory days | Whether products were available without freezing excess cash |
| Fulfilment | Order cycle, output, dispatch, returns and defects | Why the promised result was not delivered on time |
The owner needs the top level, but each variance must open into the relevant dimension. A falling margin should open into products and channels; a late dispatch should open into the order, stage and delay reason.
Core variance formulas
Absolute variance = Actual − Plan.
Plan attainment, % = Actual / Plan × 100%.
Relative variance, % = (Actual − Plan) / Plan × 100%.
The sign has a different meaning for cost than for revenue. Spending above plan is normally negative, while spending below plan may be positive or may simply mean that planned activity did not occur. Status colour cannot therefore be determined from the sign alone.
If the planned value is zero, do not calculate a percentage variance. Division by zero produces no useful management meaning. Show the absolute actual amount and identify it as unplanned activity.
Check comparability before explaining the variance
Confirm that plan and actual use the same rules:
- the same period and time zone;
- the same recognition event — order, dispatch, service acceptance or payment;
- the same treatment of taxes and discounts;
- the same currency and a defined exchange-rate policy;
- the same business units, channels and product groups;
- the same version of the cost formula;
- a consistent rule connecting returns to original sales.
If a monthly plan recognises dispatch while the actual report recognises payment, the variance does not measure performance. It measures two different event definitions.
Split revenue variance into volume and price
Assume a company planned to sell 1,000 units at UAH 1,200. Planned revenue was UAH 1,200,000. It actually sold 900 units at an average price of UAH 1,160, producing UAH 1,044,000 of revenue. Total variance is negative UAH 156,000.
Break it down in a fixed sequence:
Volume effect = (Actual units − Planned units) × Planned price.
(900 − 1,000) × 1,200 = negative UAH 120,000.
Price effect = Actual units × (Actual price − Planned price).
900 × (1,160 − 1,200) = negative UAH 36,000.
The factors reconcile to the total: negative UAH 120,000 plus negative UAH 36,000 equals negative UAH 156,000. Missing volume is the main cause, while a lower realised price made the result worse.
Why contribution variance comes next
Suppose planned variable cost per unit was UAH 720 and actual variable cost was UAH 760. Planned contribution was:
1,000 × (1,200 − 720) = UAH 480,000.
Actual contribution was:
900 × (1,160 − 760) = UAH 360,000.
The contribution variance is negative UAH 120,000. It can be reconciled as follows:
| Factor | Calculation | Effect |
|---|---|---|
| Volume | (900 − 1,000) × 480 | negative UAH 48,000 |
| Price | 900 × (1,160 − 1,200) | negative UAH 36,000 |
| Variable cost | 900 × (720 − 760) | negative UAH 36,000 |
Lower volume explains only 40% of the lost contribution. Price and cost account for the remainder. A general instruction to “sell more” will not remove those two causes.
Account for the sales mix
In a multi-product company, total units can match plan while profit does not. The cause is mix: more low-contribution items and fewer high-contribution items were sold.
Investigate through several levels:
- the company-wide variance;
- business line or channel;
- product group;
- key product, customer or order;
- the source transaction that formed the price or cost.
There is no need to analyse every line. Rank factors by impact and verify the small number of largest variances that explain most of the result.
Connect the financial variance to the process
The number says what happened, but the cause often sits inside an operation. Lower volume can result from weak demand, unavailable stock, a production delay, customers rejecting long lead times or sales enquiries that were never processed.
| Variance | Potential causes to test | Source evidence |
|---|---|---|
| Average price below plan | Discounts, channel shift or different product mix | Order lines, price rules and salesperson |
| Cost above plan | New purchase price, excess material use or urgent freight | Receipts, bills of material and material issues |
| Volume below plan | Insufficient demand, shortage or missed leads | Pipeline, stock and cancelled orders |
| Dispatch later than plan | Queue, unavailable material or repeated work | Order stages, tasks and delay reasons |
A cause must be supported by transactions. “The market declined” is not analysis until enquiries, conversion, availability, prices and cancellations have been checked.
Do not rewrite the plan to protect the result
The original plan is needed to assess the quality of assumptions and accountability. It should not be rewritten retrospectively so that actual performance always appears compliant. A current forecast can be maintained alongside it to account for changes already known.
This creates three distinct lines:
- original plan — what the company intended to achieve;
- actual — what has already happened;
- updated forecast — where the company is likely to finish under current conditions.
The forecast supports intervention before the period ends. The original plan enables learning about assumptions after the period closes.
Materiality and response rules
Investigating every difference at the same depth wastes time. Set thresholds in both percentage and money. A variance above 5%, for example, might be investigated only when its financial effect also exceeds a defined amount. Critical processes such as cash availability or a contractual customer deadline need separate rules.
Every material variance should contain:
- a concise, evidenced cause;
- a reference to the affected segment or source transactions;
- an action capable of changing the result;
- an accountable owner;
- a due date;
- a measurement date for the effect.
Common errors
- Only revenue is compared. Margin and cash may move in the opposite direction.
- Plan and actual use different event dates. The report creates a false variance.
- The total is not split into factors. The team receives a demand without understanding the cause.
- Every variance is blamed on external conditions. Internal shortages and delays go untested.
- The plan is rewritten after the result. The company loses the ability to learn from forecast errors.
- There is no review date. An action is approved but its impact is never measured.
- A percentage hides the amount. A large percentage on a minor line distracts from a material cash loss.
A practical implementation sequence
- Select 5–10 measures connected to owner decisions.
- Define formulas, periods and recognition rules.
- Save the original plan as a controlled version.
- Test the comparability of planned and actual data.
- Enable drill-down by channel, product and customer.
- Split the largest variances into volume, price, mix and cost.
- Connect financial factors to orders and process stages.
- Assign actions and review dates.
- Maintain an updated forecast without replacing the original plan.
Plan versus actual in Business Reactor
Useful variance analysis sits beside operational data. When a measure can be opened into an order, product, customer, payment or production task, finding the cause takes less time and the calculation remains auditable.
In Business Reactor, the structure of plans, dimensions and comparison rules is defined around the company’s processes. The aim is to connect a variance to the accountable area and source operation rather than merely show the owner a red percentage.
Conclusion
Plan versus actual analysis ends with an evidenced cause and assigned action, not with a difference calculation. Comparable data establishes the size, factor analysis separates volume from price and cost, and operational traceability makes correction possible.
For a broad product range, the next control level is deciding which items need daily attention and which can follow simpler policies. View the related Business Reactor solution.