


ABC/XYZ analysis classifies an assortment along two independent dimensions. ABC measures each item’s contribution to a chosen economic result. XYZ measures how evenly the item is sold or consumed over time. The combined matrix helps decide which products need daily attention, which can follow a standard replenishment rule and which should be purchased against confirmed demand.
The method does not issue an automatic command to keep or remove a product. It provides a basis for decisions about review frequency, forecasting, safety stock and purchasing attention. A reliable result requires a defined ABC measure, a suitable XYZ period and explicit treatment of seasonality, shortages and new products.
What ABC analysis measures
ABC ranks items by contribution to one selected measure. Common choices include revenue, gross profit, contribution margin, units sold or the consumption value of materials.
A typical classification is:
- A — a relatively small group producing roughly the first 70–80% of the result;
- B — the next group taking the cumulative result to roughly 90–95%;
- C — a long tail with a small individual contribution.
These boundaries are not laws. A company can choose other thresholds, but they must be defined and applied consistently. Selecting the right economic measure matters more. ABC based on revenue identifies turnover, but it can classify a high-revenue, low-margin product as A. Contribution margin is more suitable when the decision concerns profitability.
What XYZ analysis measures
XYZ assesses the stability of demand over time. For each item, take sales or consumption in equal intervals — for example, weekly values across the last 26 or 52 weeks — and calculate the coefficient of variation.
Coefficient of variation = Standard deviation of demand / Mean demand × 100%.
One practical classification is:
- X — variation up to 10%: demand is relatively stable;
- Y — 10% to 25%: noticeable fluctuation or trend;
- Z — above 25%: irregular, event-driven or hard-to-forecast demand.
Thresholds depend on the industry and interval length. A strongly seasonal product can incorrectly appear as Z when monthly values from different seasons are compared directly. Zero sales caused by zero stock must not be treated as genuine zero demand.
Prepare the source data
The calculation needs product history by equal period, including:
- quantity sold or consumed;
- revenue after discounts;
- cost and the selected margin measure;
- returns and cancellations;
- days when the product was unavailable;
- introduction and discontinuation dates;
- supplier lead time and minimum order quantity;
- promotion, seasonal-event or exceptional-order markers.
Intervals must be consistent. Do not use weeks for some products and months for others. A product introduced three weeks ago cannot be compared fairly with an item holding a full year of history. Keep new products in a separate status until enough observations exist.
ABC calculation sequence
- Select one measure, such as contribution margin for the last 12 months.
- Calculate the value for every item.
- Sort products from highest to lowest contribution.
- Calculate each item’s share of the total.
- Calculate the cumulative share.
- Assign A, B or C using the defined boundaries.
Negative contribution should not be hidden inside the ordinary C tail. Loss-making products need a separate flag because a small positive contribution and a direct loss require different decisions.
XYZ calculation sequence
- Select a consistent interval, such as one week.
- Collect demand across enough intervals.
- Correct known data gaps and flag periods of shortage.
- Calculate the mean and standard deviation.
- Calculate the coefficient of variation.
- Assign X, Y or Z using the approved thresholds.
If mean demand is zero, the coefficient is undefined. Move such products into a separate status: no movement, new, archived or data error.
Worked matrix example
Assume ABC is based on annual contribution margin and XYZ on weekly demand. Six products generate a total contribution of UAH 800,000.
| Item | Contribution margin | Cumulative share | Demand variation | Class |
|---|---|---|---|---|
| Product 1 | UAH 300,000 | 37.5% | 8% | AX |
| Product 2 | UAH 250,000 | 68.8% | 32% | AZ |
| Product 3 | UAH 120,000 | 83.8% | 15% | BY |
| Product 4 | UAH 90,000 | 95.0% | 7% | BX |
| Product 5 | UAH 30,000 | 98.8% | 20% | CY |
| Product 6 | UAH 10,000 | 100% | 55% | CZ |
Product 2 is not less important because it is Z: it creates a substantial share of contribution. Its irregularity means that simple automatic replenishment based on average use is risky. Large customer orders, spike causes, seasonality and supplier availability need separate review.
How to interpret the nine cells
| Class | Management logic |
|---|---|
| AX | High importance and stable demand: frequent review, precise replenishment parameters and high availability with controlled stock. |
| AY | High importance with variation: include trend and seasonality and review the forecast more frequently. |
| AZ | High importance and irregular demand: review large orders, spike causes and supplier conditions manually. |
| BX | Medium importance and stable demand: standard replenishment with periodic parameter review. |
| BY | Medium importance with variation: moderate safety stock plus trend and lead-time control. |
| BZ | Medium importance and irregular demand: limited stock or purchasing against confirmed need. |
| CX | Low contribution but regular movement: simple rules and aggregated control. |
| CY | Low contribution with variation: reduce order size, replenish less frequently and verify any bundle role. |
| CZ | Low contribution and irregular demand: candidate for customer-order purchasing, clearance or removal after strategic review. |
These are investigation directions, not automatic commands. Lead time, minimum quantity, customer criticality and substitutes can alter the policy. A low-value CZ component can be essential to repairing an expensive product, so its absence can stop the entire order.
Connect the matrix to inventory policy
ABC/XYZ does not calculate a reorder point by itself. Replenishment also needs average demand, supplier lead time and its variation, target availability, minimum quantity and shortage cost.
The general logic is:
- X items can use regular replenishment based on average use and lead time;
- Y forecasts should incorporate trend, seasonal factors or an event calendar;
- for Z, an average is often unreliable, so confirmed orders, scenarios and manual review are more appropriate;
- an availability or purchasing error on A has a larger financial effect, so data and parameters deserve more frequent review;
- for C, the cost of sophisticated management can exceed the product’s economic contribution, so control can be simplified.
Seasonality, shortages and outliers
Three situations distort XYZ particularly strongly:
- Seasonality. Assess stability within comparable seasons or use a seasonally adjusted series.
- Shortages. Zero sales with zero available stock do not prove zero demand. Flag these periods.
- One exceptional order. Do not remove it automatically. Determine whether it is random, a new channel or a repeatable customer pattern.
Recalculate regularly, but not daily without a business reason. Monthly classification is often sufficient for a stable assortment; rapidly changing ranges may require more frequent review. Retain the previous class so meaningful transitions remain visible.
Common ABC/XYZ mistakes
- ABC uses revenue only. A high-turnover loss-making product reaches A.
- Z is treated as a bad class. Irregular demand can still create major contribution.
- Out-of-stock periods are ignored. A shortage is mistaken for weak demand.
- New products are compared with full-year history. The class lacks adequate evidence.
- Thresholds change every month. Movement between groups becomes uninterpretable.
- The matrix is not connected to action. Categories change but purchasing parameters do not.
- Bundles and criticality are ignored. A component’s low individual contribution hides its role in a larger sale.
A practical implementation plan
- Define the management purpose of the analysis.
- Select the ABC measure and set group boundaries.
- Select the XYZ horizon and interval.
- Flag shortages, new products, archived products and exceptional events.
- Manually verify the largest A items and the most volatile Z items.
- Build the nine-cell matrix.
- Assign a review and replenishment policy to each cell.
- Add lead time, minimum quantity and business criticality.
- After one purchasing cycle, measure shortages, stock and cash tied up.
- Recalculate with the same rules and explain material class movements.
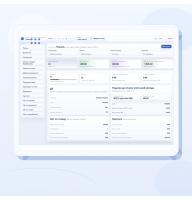
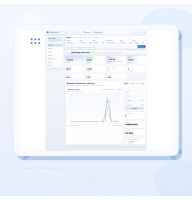
ABC/XYZ in Business Reactor
The matrix is more reliable when it uses actual sales, issues, returns and out-of-stock periods. A class should be traceable to source movements; otherwise an outlier or stock error can silently change purchasing policy.
In Business Reactor, the analysis dimension and class rules are defined around the company’s decision. The result can be used alongside assortment and stock control. Specific replenishment parameters still need configuration for supplier lead times and the purchasing process.
Conclusion
ABC/XYZ inventory analysis combines economic importance with demand stability. It replaces one control method for the entire catalogue with differentiated attention, but it does not replace management judgement. Add margin, lead time, criticality and explicit replenishment rules to the matrix.
Start with one warehouse and one product group, verify the source data and measure the result after a complete purchasing cycle. View the related Business Reactor solution.