Inventory turnover measures how quickly cash invested in goods travels from purchasing to sale. It can be expressed as the number of turns in a period or the average number of days held. More turns and fewer days return cash faster, but stock that is too low can cause shortages and lost sales.
For a valid calculation, cost of sales and inventory must use the same valuation basis, normally cost. The result should then be compared only across similar products, periods and business models. There is no single good number of days for every category.
Two forms of the same measure
Measure
Formula
Meaning
Inventory turnover ratio
Cost of sales / Average inventory
Number of complete inventory turns during the period
Inventory days
Average inventory / Cost of sales × Days in period
Average time cash remains invested in stock
The formulas are connected. If the annual ratio is 7.3, approximate inventory days are 365 / 7.3 = 50. For a month or quarter, use the actual number of days in that reporting period.
Why cost rather than revenue is used
Warehouse inventory is normally valued at purchase or production cost. If revenue is placed in the numerator, the calculation includes the sales markup even though that markup is absent from inventory value. The resulting turnover is artificially high.
Units can be used for a homogeneous item whose price is reasonably stable. For a mixed assortment, a consistent monetary cost basis is more reliable.
Determine representative average inventory
The simplest method is:
Average inventory = (Opening inventory + Closing inventory) / 2.
This is acceptable when the balance moved relatively evenly. A large delivery, clearance sale or seasonal peak in the middle of the period makes two data points misleading. In that case, calculate an average from daily or at least weekly closing balances.
Daily average inventory = Sum of each day’s closing inventory / Number of days.
Define whether inventory in transit, reserved stock, defects, returns and consignment goods are included. The policy must remain consistent when periods are compared.
Worked calculation
A hypothetical company recorded annual cost of sales of UAH 3,650,000. Opening inventory was UAH 420,000 and closing inventory was UAH 580,000.
The average amount invested in inventory returned through cost of sales roughly once every 50 days. This does not mean that every product remained for exactly 50 days: fast items can conceal slow products stored for several months.
Open the total into segments
Company-wide turnover can look stable while opposite changes occur inside the assortment.
Group
Average inventory
Annual cost of sales
Inventory days
Core range
UAH 260,000
UAH 2,600,000
36.5
Seasonal goods
UAH 140,000
UAH 700,000
73
Long tail
UAH 100,000
UAH 350,000
104
Each group needs a different response. The core range requires protection from shortage, the seasonal group needs a cycle-aware comparison, and the long tail needs a review of order quantities, reorder points and items without movement.
Estimate cash tied to excess days
Average daily cost of sales in the example is 3,650,000 / 365 = UAH 10,000. If the company can safely reduce inventory from 50 to 40 days while preserving sales, the indicative release is:
10 days × UAH 10,000 = UAH 100,000.
This is neither guaranteed saving nor profit. It is an estimate of cash that would no longer remain continuously invested in goods. Supplier lead time, minimum quantity, demand variation and target availability must be checked before stock is reduced.
Faster is not always better
Turnover can improve because inventory is insufficient. When a popular product is frequently unavailable, the average balance falls and the ratio rises, but the company loses sales and customers.
Monitor these measures beside turnover:
out-of-stock days;
orders completed in full;
cancellations caused by shortage;
supplier lead time and its variance;
contribution margin;
available, physical and reserved stock.
The objective is not the smallest possible warehouse. It is the lowest economically justified inventory at the required service level.
Choose a meaningful comparison
Useful comparison bases include:
the same product group in a comparable prior period;
target inventory days connected to supplier lead time;
products with a similar demand pattern;
the same season last year;
actual performance before and after a purchasing-policy change.
Comparing fresh food with long-tail spare parts provides no useful conclusion. An external industry benchmark should not be adopted automatically without understanding the range, supply geography and service level.
Find the cause of slower turnover
Observation
What to check
Possible cause
Stock increased while sales stayed stable
Order size, purchase schedule and supplier minimums
More is purchased than needed before the next delivery
Sales fell while stock did not
Demand, price, competition and range changes
Purchasing did not react to weaker demand
Total turnover is normal but some items do not move
SKU-level days and last movement date
Fast products hide a stagnant tail
Inventory days rose after a delivery
Seasonality and sales plan before the next replenishment
Valid seasonal build-up or premature purchasing
Turnover is fast but orders are incomplete
Shortages and lost demand
Inventory was reduced below operational need
Common calculation errors
Revenue is divided by cost-valued inventory. Markup overstates the speed.
Only closing inventory is used. One day cannot represent the whole period.
Physical and available stock are mixed. Reserved goods appear free for sale.
Shortages are ignored. Lost sales look like high efficiency.
Unlike groups are compared. Different lead times and demand patterns need different targets.
An average replaces SKU analysis. Slow products remain concealed.
Stock is cut without checking supply. Cash is released at the cost of failed orders.
A practical analysis sequence
Select a period and consistent cost basis.
Calculate average inventory from enough observations.
Calculate turns and days for the company.
Open the result by warehouse, category and ABC/XYZ group.
Identify both no-movement items and shortage items.
Check lead time, minimum quantity and reservations.
Estimate cash tied to excess inventory days.
Change parameters only for defined groups.
After a complete purchasing cycle, recalculate and check order fulfilment.
Inventory turnover in Business Reactor
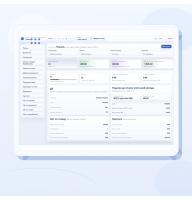
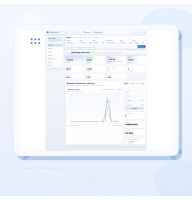
The measure is more reliable when it is calculated from actual sales, costs and daily warehouse movements. The total should open into category and product, and any disputed number should be traceable to a receipt, reservation, dispatch or return.
In Business Reactor, calculation rules and dimensions are configured around the company’s warehouse and purchasing structure. Inventory days can then be connected to availability, orders and contribution rather than maintained in a separate spreadsheet with a different stock state.
Conclusion
Inventory turnover measures how quickly cash returns from goods, but it does not provide a universal target. Use comparable cost values and representative average inventory, open the result into segments and always assess shortages beside excess days.
After measuring speed, the next step is setting a replenishment trigger that reflects demand, lead time and safety stock.Business Reactor Analytics and Control.