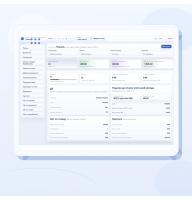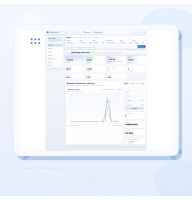



A company-wide margin does not reveal who or what actually creates profit. A strong product group can subsidise a weak channel, a large customer can consume margin through discounts and expensive service, and a fast-growing marketplace can increase revenue while contributing very little towards fixed costs.
To see the underlying economics, analyse margin across at least three dimensions: product, customer and sales channel. Apply the same level of profit to each dimension and assign only those costs whose relationship to the segment can be explained and verified.
Choose the level of margin first
The word “margin” is often used for different results. If one report deducts only purchase cost while another also deducts commission, delivery and returns, their percentages are not comparable.
| Level | Calculation | Decision it supports |
|---|---|---|
| Gross margin | Revenue less purchase or production cost | Initial product and price assessment |
| Contribution margin | Revenue less all direct variable costs | Discounts, channels, range and minimum order value |
| Segment result | Contribution less justified direct fixed costs of the segment | Keep, change or close a business line |
Contribution margin is usually the most useful level for operational analysis. It shows how much a segment contributes towards shared fixed costs without creating a debatable allocation of the entire administrative cost base to each item.
Build one consistent source dataset
Price and purchase cost are not enough. Each sales line should be connected to a minimum set of data:
- the product or service;
- the customer or customer group;
- the channel and order source;
- the salesperson, where their contribution is being assessed;
- quantity and net revenue after discount;
- purchase or production cost;
- channel and payment commission;
- packing, fulfilment and delivery cost;
- returns, cancellations and associated losses;
- transaction date and fulfilment status.
If a cost is available only as a monthly total, define a reasonable allocation rule and disclose it. Where a cost arises from a particular sale, linking it to the source transaction is more reliable than spreading it approximately at month end.
Analyse margin by product
The product view answers more than “what sells?” It shows what produces contribution. For each item or product group, compare:
- revenue and units sold;
- gross margin and contribution margin;
- average discount;
- return rate;
- stock turnover and cash tied up in inventory;
- frequency of attachment to other products.
A low margin does not automatically justify delisting a product. It might acquire customers, enable a profitable companion sale or keep production capacity in use. That role, however, must be supported by evidence. “It sells frequently” is not enough when the item creates workload but little or no contribution.
Worked product comparison
| Measure | Product A | Product B |
|---|---|---|
| Revenue | UAH 300,000 | UAH 420,000 |
| Cost of goods | UAH 180,000 | UAH 294,000 |
| Discounts and direct costs | UAH 30,000 | UAH 105,000 |
| Contribution margin | UAH 90,000 | UAH 21,000 |
| Contribution margin percentage | 30% | 5% |
Product B produces more revenue, yet Product A contributes more than four times as much. The immediate response need not be to remove B. Management should first test its price, discount, supplier terms, logistics cost and role within a combined order.
Analyse margin by customer
The largest customer is not necessarily the most profitable. In addition to product cost, an account may receive a special discount, free delivery, extended payment terms, frequent returns and substantial manual support.
A customer comparison should include:
- revenue and contribution margin;
- average discount;
- order frequency and order size;
- fulfilment and delivery cost;
- returns, complaints and cancellations;
- payment period and overdue debt;
- acquisition cost where the source is known;
- value across the whole relationship rather than one order.
A customer generating a 12% margin through regular prepaid orders may be more valuable than an 18% customer who requires long credit, emergency dispatch and continuous manual intervention.
The decision is not limited to keeping or rejecting the customer. A minimum order value, account-specific price, delivery terms, credit limit or service level can often restore the economics without ending the relationship.
Analyse margin by sales channel
A direct website, salesperson-led sales, a marketplace and a physical outlet carry different costs. Charging the same product price does not make the channels equally profitable.
Worked channel comparison
| Measure | Own website | Marketplace |
|---|---|---|
| Revenue | UAH 300,000 | UAH 400,000 |
| Cost of goods | UAH 180,000 | UAH 240,000 |
| Discounts | UAH 10,000 | UAH 0 |
| Commission and advertising | UAH 0 + UAH 25,000 | UAH 60,000 + UAH 35,000 |
| Logistics and returns | UAH 15,000 + UAH 5,000 | UAH 30,000 + UAH 20,000 |
| Contribution margin | UAH 65,000 | UAH 15,000 |
| Contribution margin percentage | 21.7% | 3.8% |
The marketplace generates one-third more revenue but contributes very little towards fixed costs. Possible responses include increasing the channel price, narrowing the listed range, changing the advertising model, renegotiating delivery participation or using the channel mainly for customer acquisition while measuring later repeat purchases.
Do not allocate every overhead mechanically
The desire to calculate “net profit per product” often leads to arbitrary allocations of rent, the managing director’s salary and other shared costs. The answer depends on the chosen allocation base — revenue, units, time or floor area — and can change radically while the underlying operation stays exactly the same.
A more practical structure has several levels:
- direct contribution margin;
- result after the segment’s direct fixed costs;
- the company’s total operating result.
Allocate shared overhead only for a defined decision and always show the rule. A product should not be discontinued solely because of a notional share of costs that will remain after the product disappears.
Select a meaningful comparison period
One month can be misleading for a seasonal product, a new customer or a channel in launch mode. Compare several windows:
- the current month for immediate deviations;
- a rolling three months to smooth one-off events;
- year on year to account for seasonality;
- the full customer relationship for acquisition and repeat purchase value.
A long average must not be allowed to hide a new problem. If commission changed yesterday, the new rate and its effect should be visible separately.
Turn the report into a decision
The output of the analysis should be a management action with an owner and a review date, not merely another table.
| Observation | What to investigate | Possible action |
|---|---|---|
| High product revenue and low contribution | Price, discount, purchasing and returns | Change price or supplier terms |
| A large customer contributes very little | Delivery, credit and manual service | Revise terms and minimum order value |
| A channel grows but profit does not | Commission, advertising, logistics and returns | Change range or channel economics |
| Margin falls across every segment | Purchase prices, general discounts and data errors | Reprice and verify the cost source |
Every change needs a control period. Closing a segment after one month without checking seasonality, its role in the range and subsequent customer behaviour creates unnecessary risk.
Common analysis errors
- Different margin levels are compared. Delivery is included in one channel but excluded from another.
- Revenue is treated as value. Sales growth conceals a falling contribution.
- Returns are posted to the current month without the original sale. Both periods are distorted.
- An average customer replaces segmentation. Profitable and unprofitable relationships are mixed together.
- Direct costs are allocated approximately. The operational cause is lost.
- A decision is never measured again. The company changes price but does not test the result.
A practical implementation sequence
- Define the formula and each level of margin.
- Select the reporting period and tax treatment rules.
- Connect direct costs to the sale, product, customer and channel.
- Verify the ten largest segments manually before building the full report.
- Create product, customer and channel views from the same dataset.
- Trace every material deviation back to its source transactions.
- Assign an action, an owner and a review date.
- Recalculate when prices, commissions or the sales mix change.
Approaching the task in Business Reactor
Analysis is most useful when it is built from the same operations used by the working team. A result should be traceable to the order, product, customer and connected cost; otherwise the discussion quickly returns to competing spreadsheet versions.
In Business Reactor, calculation rules and dimensions are defined around the company’s actual process. The purpose is to connect the sale, fulfilment and financial outcome so that the owner can see not only the deviation but also the operation that produced it.
Conclusion
Profit margin analysis by product, customer and channel begins with a consistent formula and traceable costs, not with a dashboard. Revenue then stops being the only test of value: management can see each segment’s real contribution and change the price, terms, range or process on the basis of source transactions.
Start with the ten largest segments, verify their source operations and assign one measurable action to each material deviation. View the related Business Reactor solution.