


Contribution margin is the amount of revenue left after variable costs. It first pays the company’s fixed costs and then produces operating profit. The break-even point is the sales volume at which total contribution exactly equals fixed costs: the business is no longer making an operating loss, but it has not yet made a profit.
The calculation answers a concrete owner-level question: how many units, or how much revenue, must be sold under the current price and cost structure? It also reveals how a discount, a supplier price increase or a demand decline changes the economic threshold.
Separate variable and fixed costs first
A useful calculation depends on a disciplined cost classification.
| Cost type | Behaviour | Examples |
|---|---|---|
| Variable | Arises or changes with each unit sold or produced | Materials, purchase cost, commission, packaging, piecework and company-paid delivery |
| Fixed | Does not directly change with short-term sales volume | Rent, administrative salaries, core subscriptions, security and the fixed portion of utilities |
The boundary depends on the business model and the period. Production electricity may contain a fixed base charge and a variable process component. A salesperson may receive a fixed salary plus a commission. Mixed costs should be separated rather than forced entirely into one category.
Contribution margin per unit
Contribution margin per unit = Selling price − Variable cost per unit.
Assume a product sells for UAH 1,200 and materials, packaging, commission and other variable costs total UAH 720. Contribution per unit is:
1,200 − 720 = UAH 480.
That UAH 480 is not net profit. It first contributes to the fixed expenses of the month. Only after all fixed costs have been covered does the next unit begin to create operating profit.
Break-even point in units
Break-even units = Fixed costs / Contribution margin per unit.
If monthly fixed costs are UAH 240,000 and contribution per unit is UAH 480:
240,000 / 480 = 500 units.
The first 500 units cover the fixed-cost pool. The 501st unit creates the first UAH 480 of operating profit, provided the price and variable cost remain unchanged.
Break-even revenue is:
500 × 1,200 = UAH 600,000.
Break-even revenue using the contribution ratio
A unit calculation becomes awkward when a company sells many products. The contribution margin ratio is then useful:
Contribution margin ratio = Contribution margin / Revenue.
In the example:
480 / 1,200 = 0.40, or 40%.
Break-even revenue is therefore:
Fixed costs / Contribution margin ratio = 240,000 / 0.40 = UAH 600,000.
For a multi-product business, this result is reliable only while the sales mix remains reasonably stable. If low-contribution products take a larger share, the weighted ratio declines and the real break-even revenue increases.
Sales volume for a target profit
Breaking even is not a business objective. To calculate the volume required for a target operating profit, add that target to fixed costs:
Required units = (Fixed costs + Target profit) / Contribution per unit.
If the owner wants UAH 120,000 of operating profit:
(240,000 + 120,000) / 480 = 750 units.
Required revenue is UAH 900,000. Management can now compare this result with production capacity, working days, the sales team’s throughput and realistic market demand.
What a 10% discount really changes
Suppose the price falls from UAH 1,200 to UAH 1,080 while variable cost remains UAH 720. Contribution falls from UAH 480 to UAH 360 — a 25% reduction.
The new break-even point is:
240,000 / 360 = 667 units.
A 10% price discount requires sales to rise from about 500 to 667 units, an increase of 33.4%, merely to preserve the zero-profit result. A discount should therefore be assessed through the remaining contribution and the volume increase that the market can realistically provide.
What a variable-cost increase changes
If the price stays at UAH 1,200 but variable cost rises from UAH 720 to UAH 800, contribution falls to UAH 400. Break-even volume rises to 600 units.
The company can respond in several ways:
- increase price;
- renegotiate purchasing terms or redesign the bill of materials;
- reduce commission and logistics cost;
- change the sales mix;
- reduce fixed costs;
- accept a lower profit as a deliberate strategic decision.
The formula does not choose the action. It makes the economic cost of each option visible.
Margin of safety
Selling above break-even does not automatically make the business resilient. The margin of safety measures how far current revenue can fall before the operation moves into loss:
Margin of safety = (Actual revenue − Break-even revenue) / Actual revenue × 100%.
If actual revenue is UAH 800,000 and break-even revenue is UAH 600,000:
(800,000 − 600,000) / 800,000 × 100% = 25%.
Revenue could fall by roughly one quarter before crossing the operating break-even boundary. This metric does not account for payment timing, inventory purchases or debt repayment, so a profitable model can still experience a cash shortage.
The multi-product complication
Products with different contribution margins cannot be treated as interchangeable units. Product A may contribute UAH 500 while product B contributes UAH 150. If the plan assumes a high share of A but actual growth comes from B, total order count can meet plan while contribution remains insufficient.
A weighted contribution ratio can be used for a relatively stable sales mix, while key product groups are monitored separately. When the mix changes materially, break-even must be recalculated rather than carried forward as a permanent company number.
When the model becomes misleading
- Variable costs are incomplete. Commission, packing, returns or sales bonuses remain outside the model.
- Fixed costs come from an unusually convenient month. Seasonal payments and irregular obligations disappear from the calculation.
- Periods are mixed. Monthly contribution is compared with quarterly fixed cost.
- Capacity is ignored. The profit target requires 750 units while production can deliver only 600.
- The average margin is assumed to be permanent. Discounts and mix changes quickly invalidate the ratio.
- Profit is confused with cash. Payment terms, inventory and liabilities affect cash flow on a separate timeline.
A practical calculation sequence
- Select one period, normally a month.
- Split each cost into fixed and variable components.
- Verify variable costs against source transactions.
- Calculate contribution for key products or services.
- Determine break-even in revenue and, where meaningful, in units.
- Add target profit and calculate the required volume.
- Compare that volume with demand, capacity and available working time.
- Model a discount, a cost increase and a sales decline.
- Define the conditions that trigger a recalculation.
Using the calculation in Business Reactor
A one-off spreadsheet is not enough for regular control. Prices, purchase costs, commissions and volumes change, so the calculation needs current operational data and one consistent cost policy.
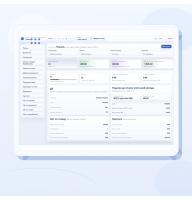
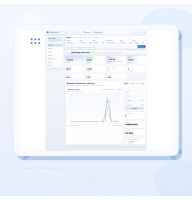
In Business Reactor, this management view is designed from source operation to indicator: a sale creates revenue, connected costs form the variable layer and periodic expenses form the fixed layer. The exact data and formulas are configured around the company’s process so the owner can see both the result and the reason for deviation.
Conclusion
Break-even is not a sales forecast. It is the boundary of an economic model under a given price, variable-cost and fixed-cost structure. It identifies the minimum volume, but the decision must still be tested against demand, capacity, product mix and cash flow.
Once the overall threshold is known, the next question is which products, customers and channels actually create the contribution. Continue with the related profitability-analysis article. View the related Business Reactor solution.